This is the home page for our DSC 180 Capstone project. See our github repo here. See our project report here.
By Priyanka Nagasamudra, Luke Lloyd
Abstract
Unsupervised domain adaptation is an important problem in machine learning. Machine learning models trained on a certain dataset often are tested on datasets that are drawn from a different distribution. The aim of our work is to find methods to provide the same performance of the machine learning model on a test distribution as the train distribution. We propose using optimal transport to achieve this and demonstrate results on a model used to asses poverty in Africa.
Dataset
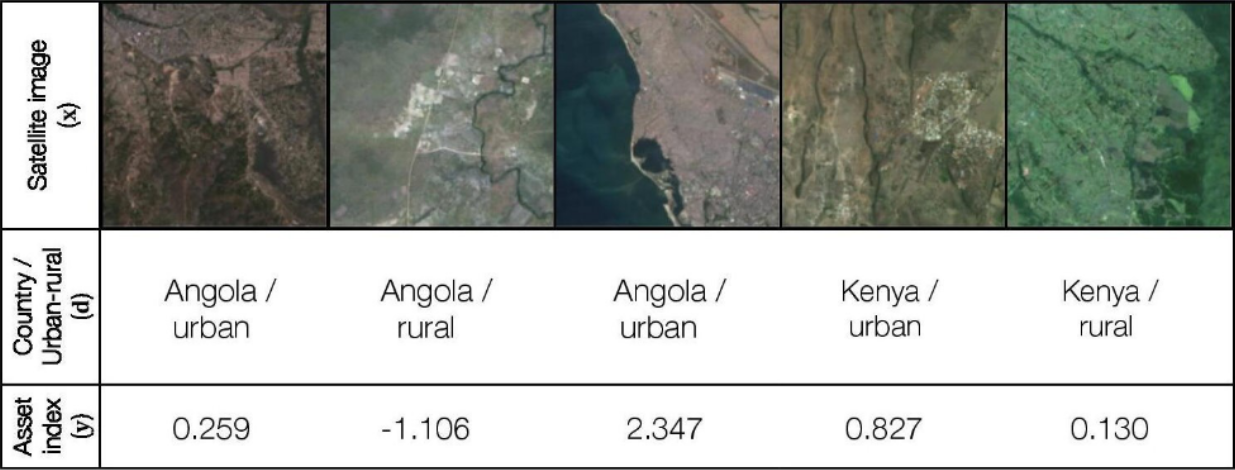
- x values
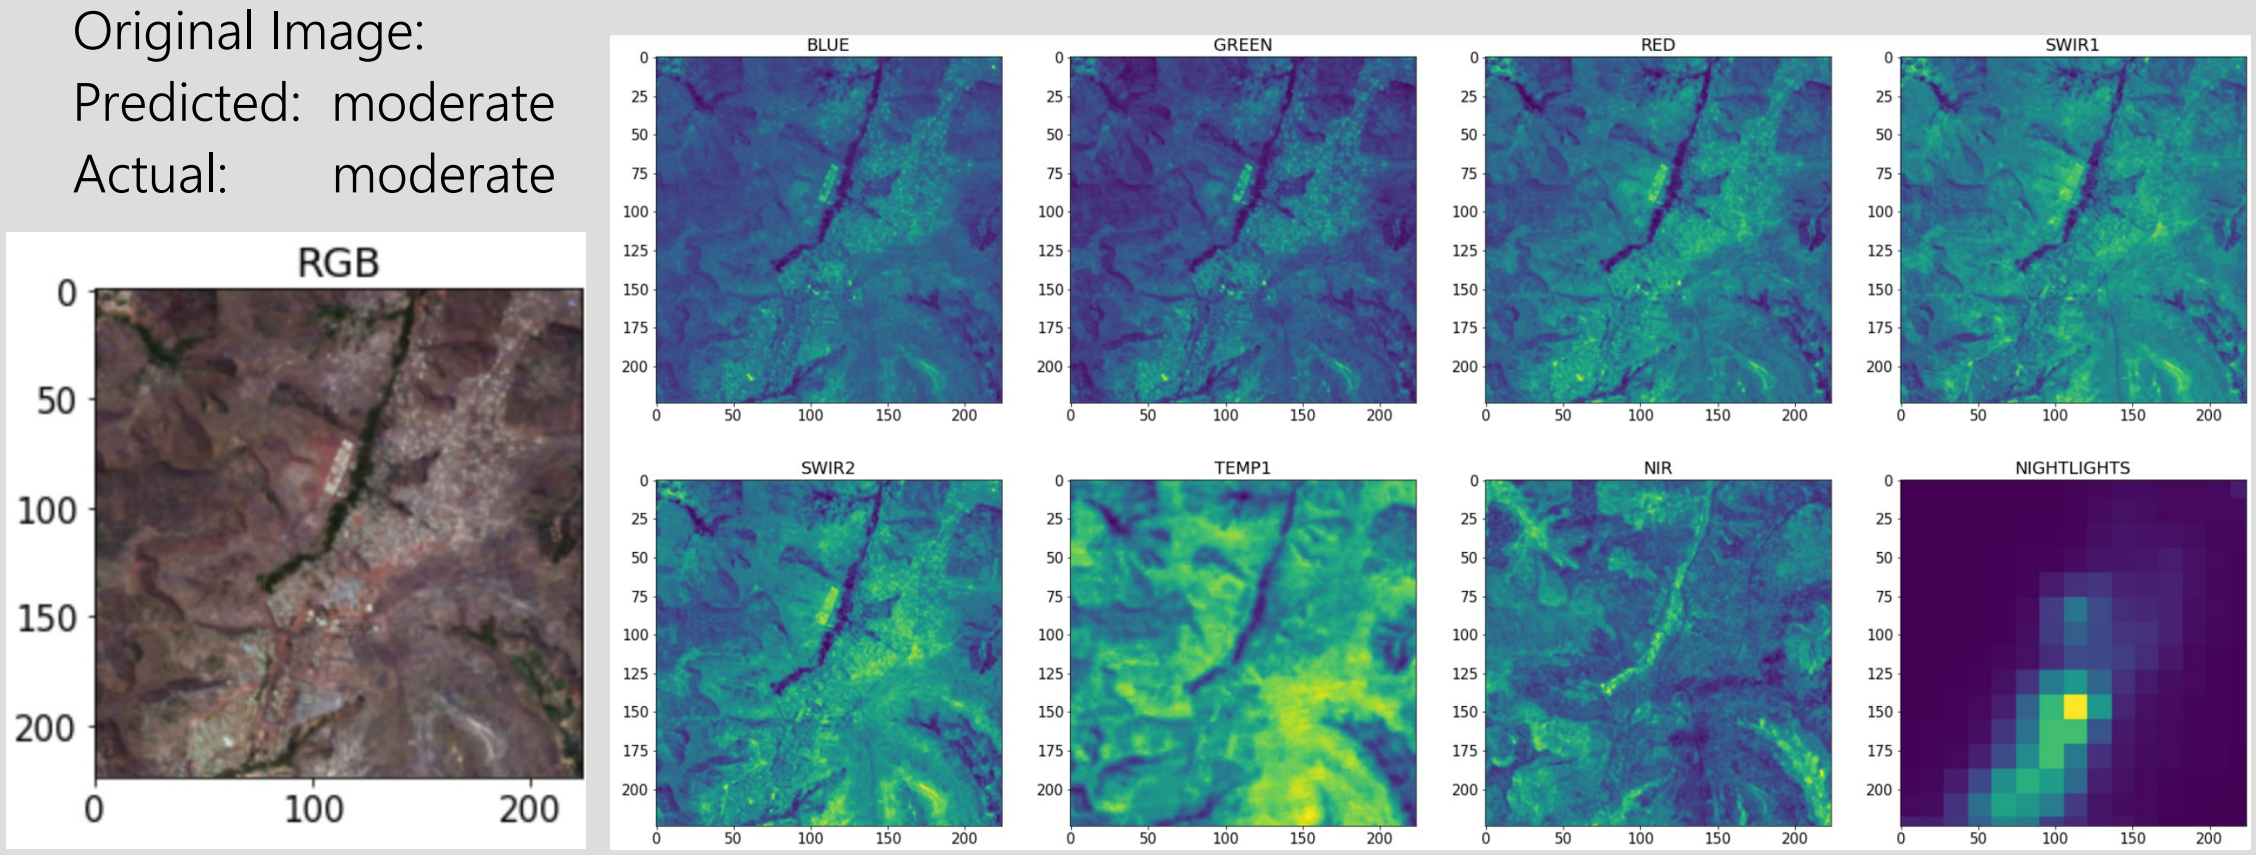
- 8 channel satellite images
- RGB, Near Infrared, Infrared, Temperature, Nightlight
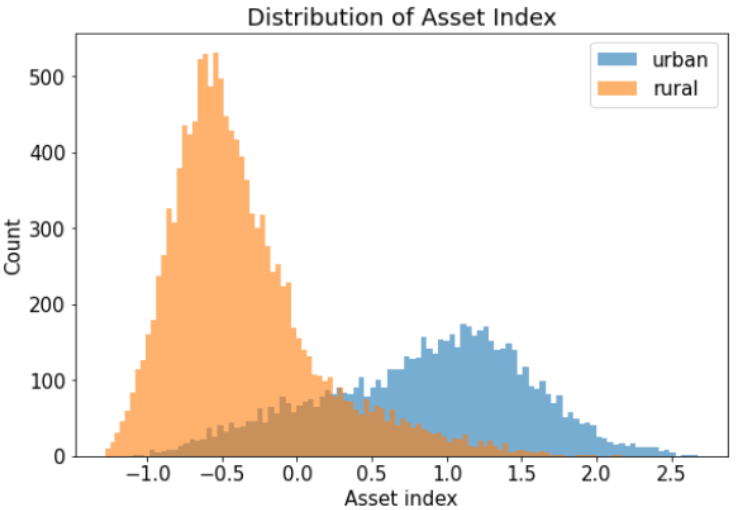
- urban vs. rural
- very predictive, so we split between urban and rural in preprocessing step
- 8 channel satellite images
- y values
- Asset index
- Domain information
- country
Preprocessing
- For all domains and models
- split the data into “Urban” and “Rural”
- image channels already normalized by wilds
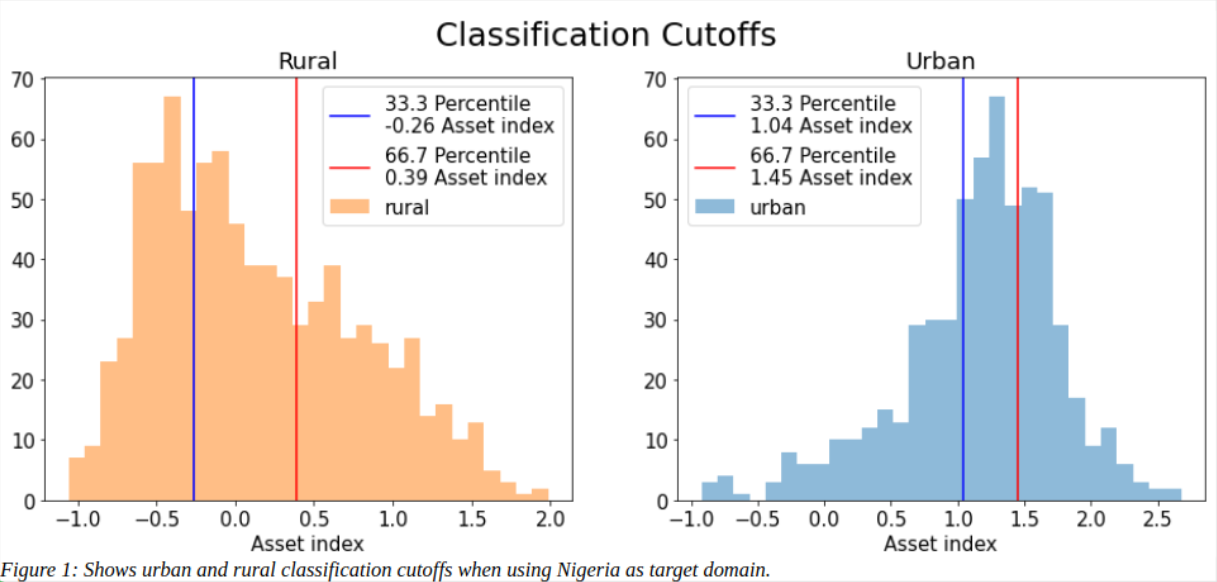
- For target domain
- derived classification cutoff values for urban and rural separately
- split into 3 classes, each with equal amount of data
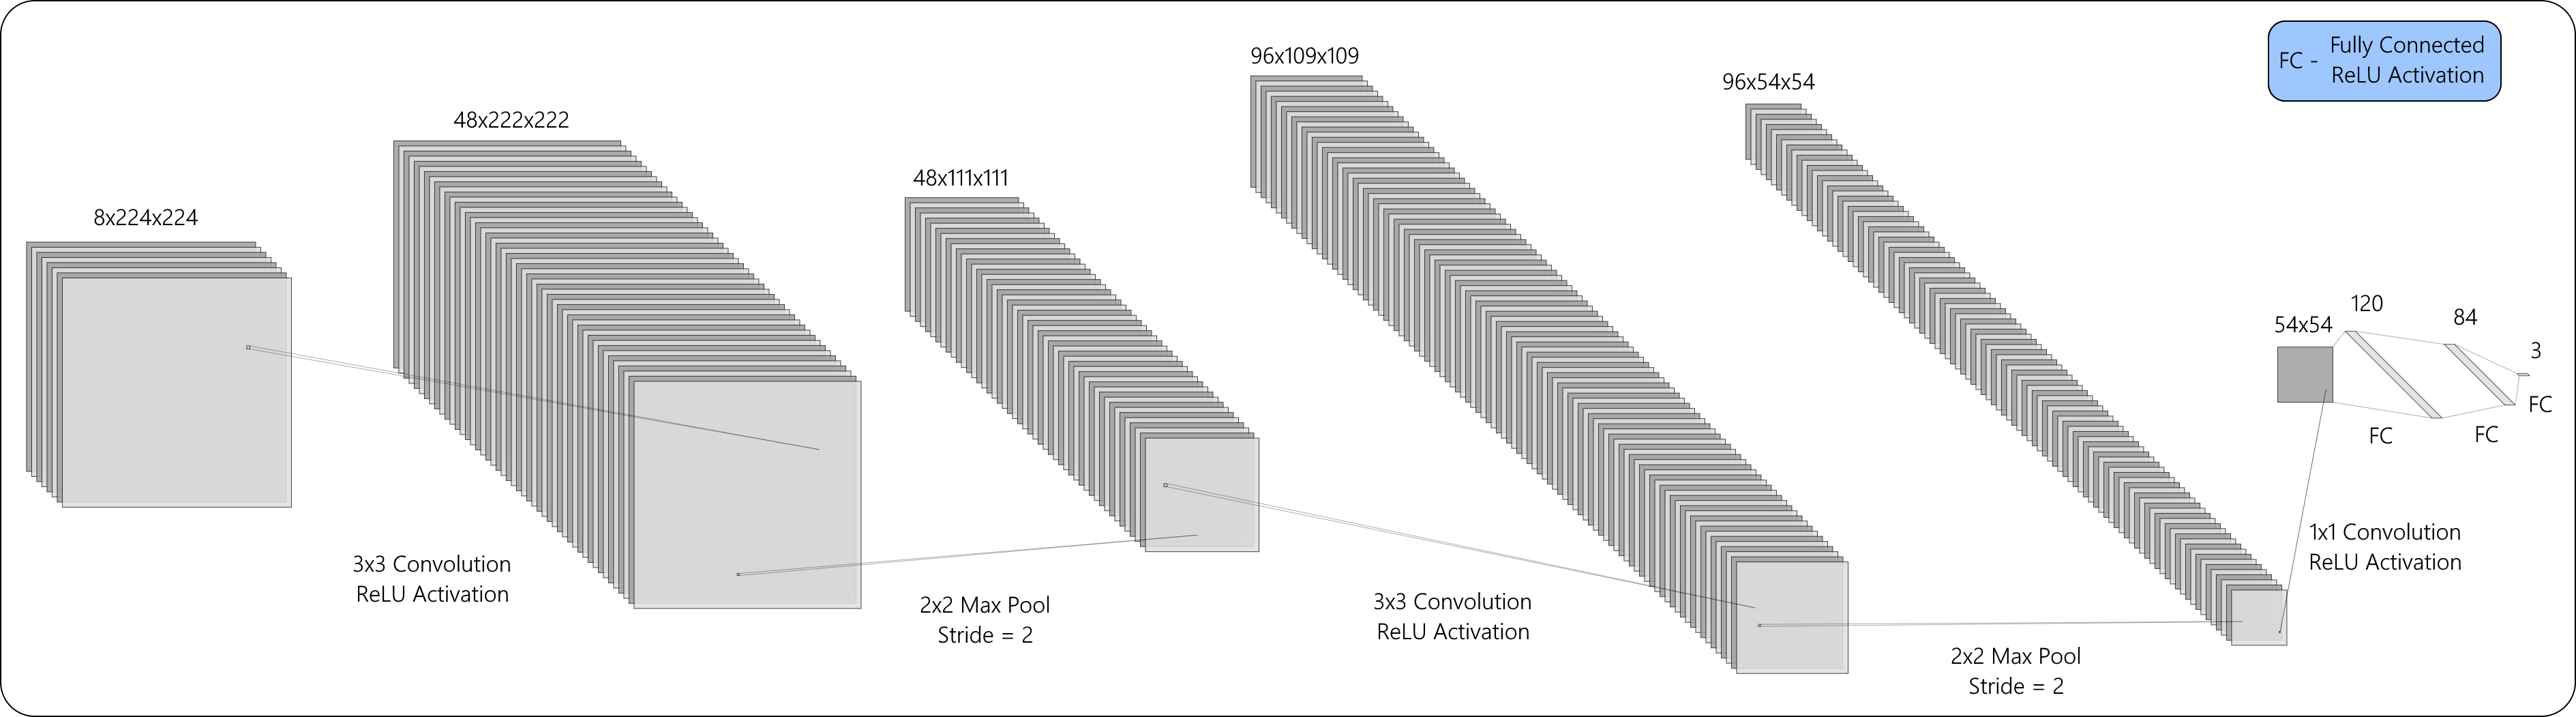
ML Model
We used a convolutional neural network for this classification task. It seemed like an obvious choice as CNNs have led in the field of computer vision for around a decade now. We experiemented with other methods, but weren’t able to get them into a usable state. The architecture we used was completely custom, and can been seen below.
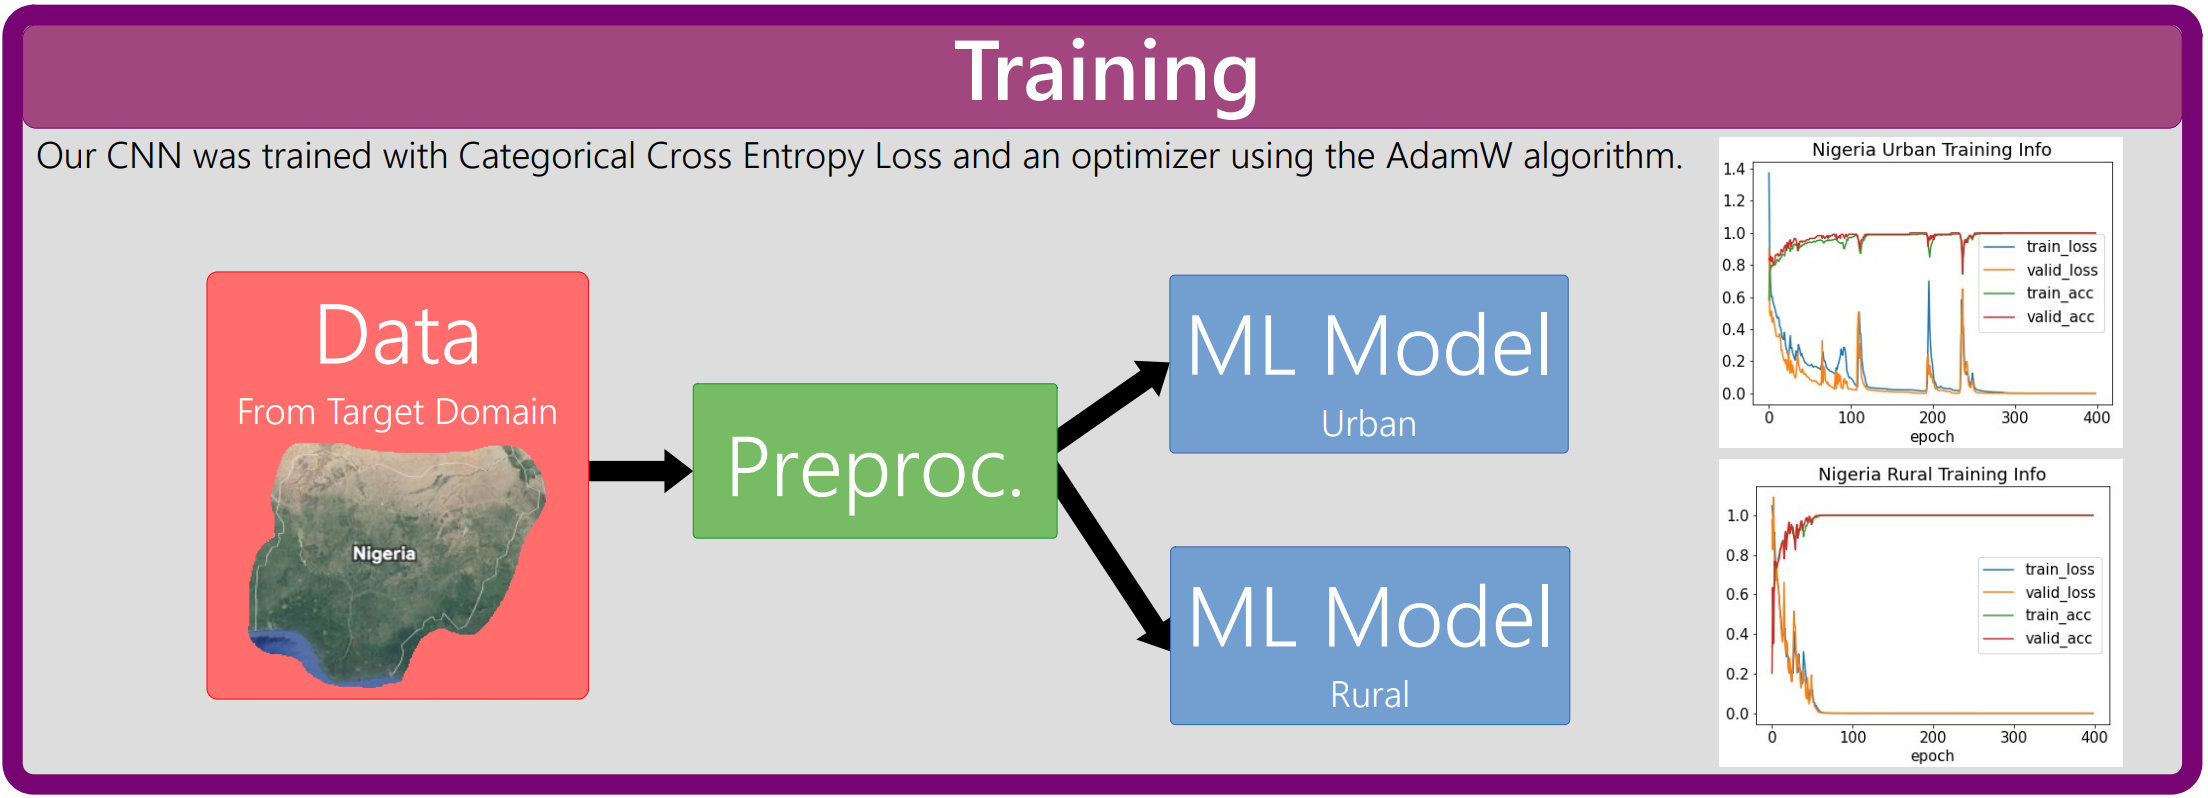
Training
To train our model, we first gathered all images from one country (domain). Next, we preprocessed this data, splitting it into images of rural areas and images of urban areas. Finally we trained two convolutional nets to classify the areas captures in these images into three relative wealth categories.
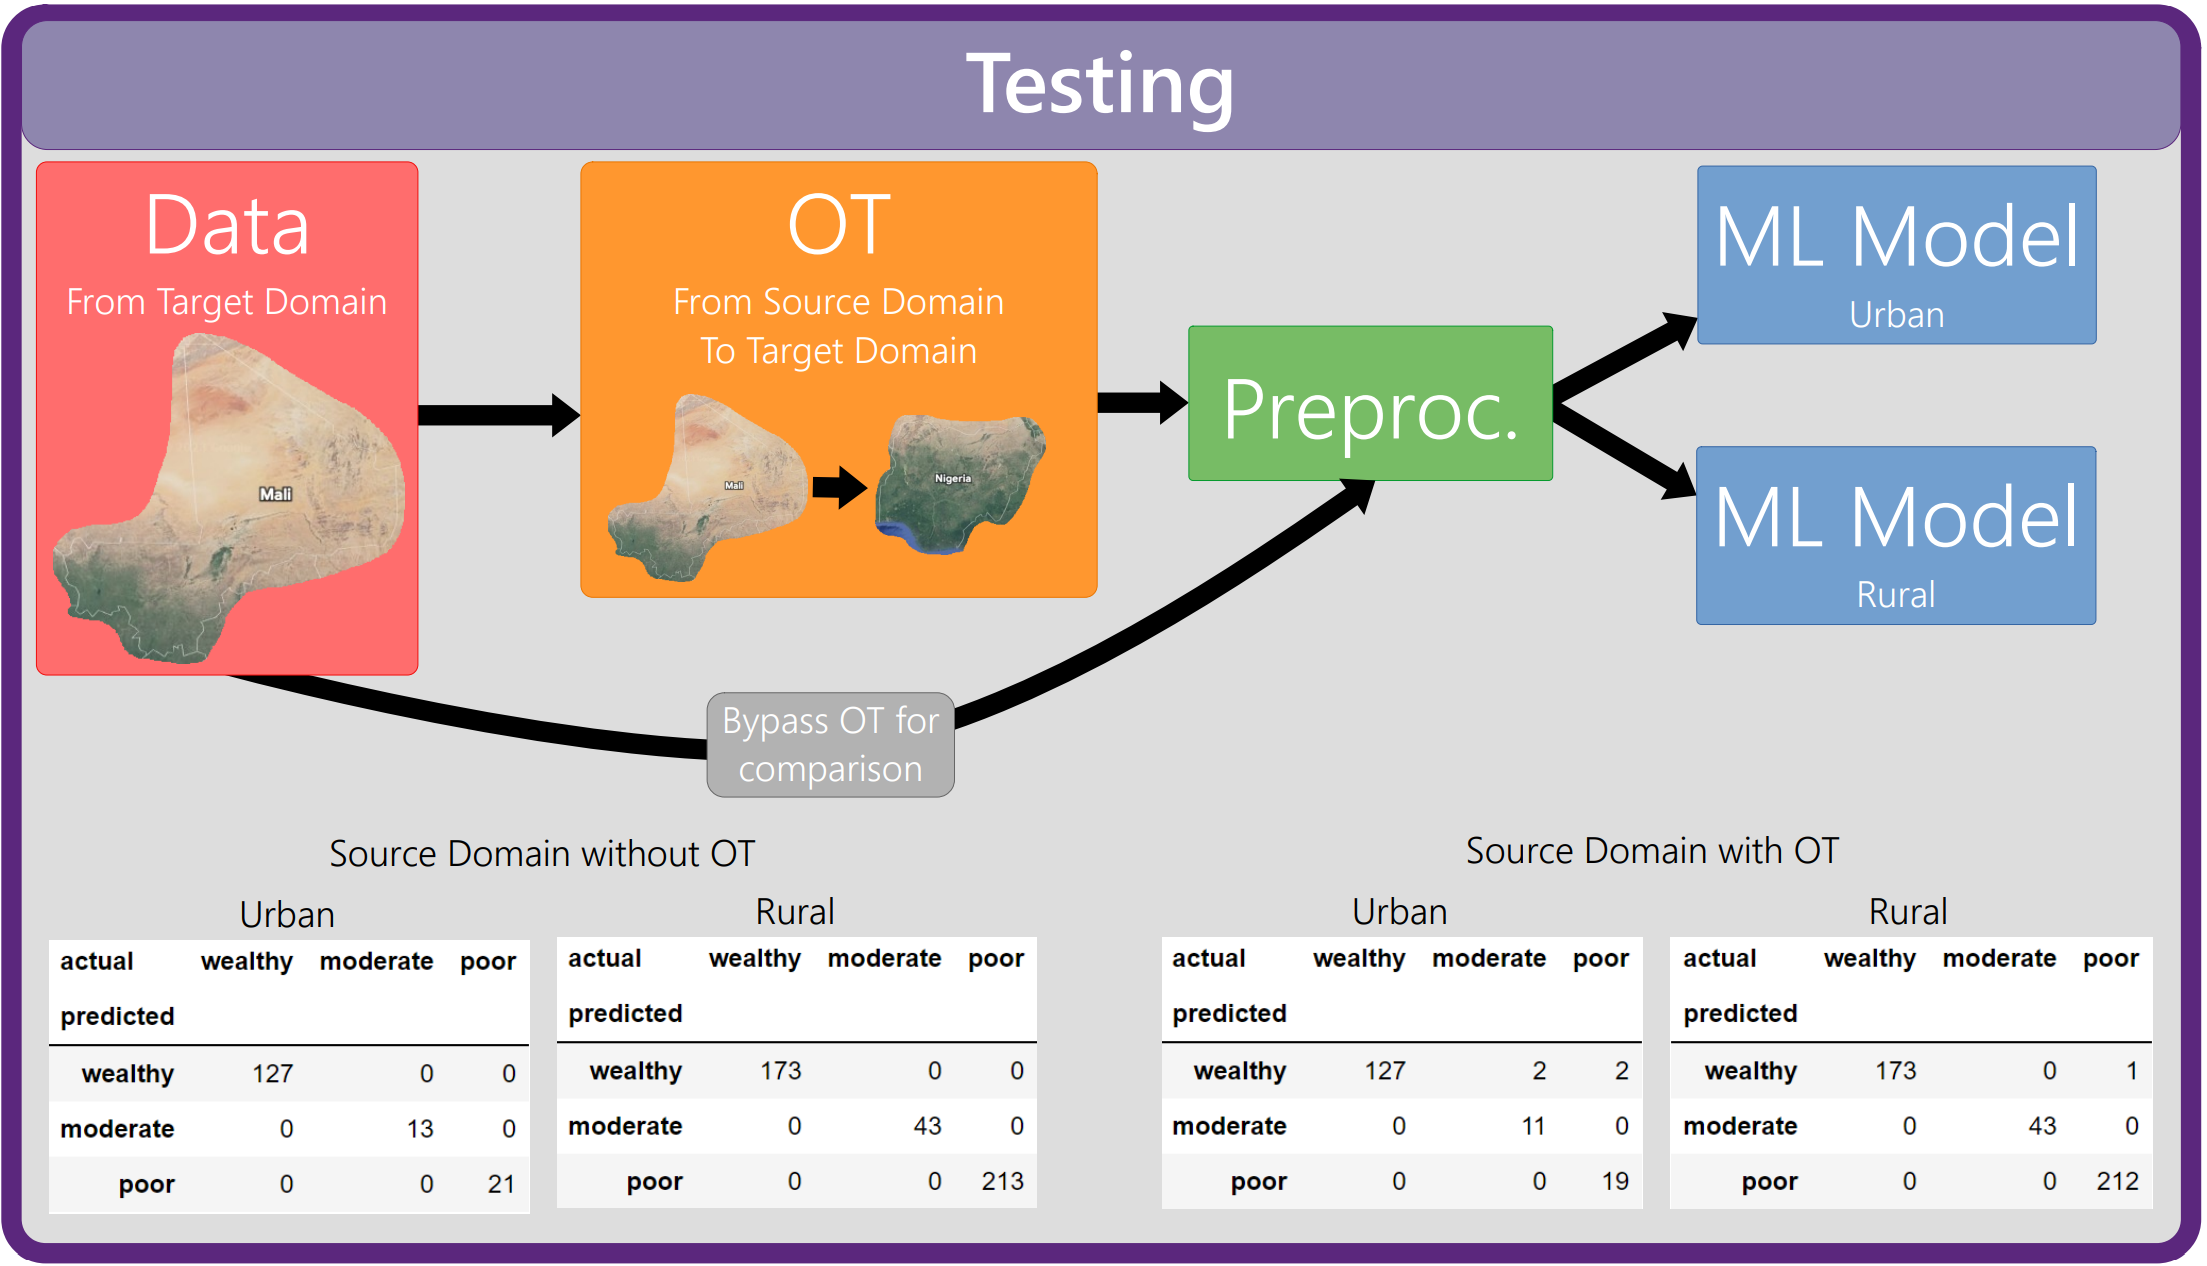
Testing
To test if optimal transport was an effective method for unsupervised domain adaptation for this task, we first gathered data from a selected source country (source domain). We then used the sinkhorn algorithm to transport the color distributions of these images to fit the distribution of the target county (target domain). Finally, we evaluated our convolutional nets on both the transported and untransported images. The results can be seen in the image below.
Optimal Transport
Mathematical definitions can be found on our paper.
In essence, this is how optimal transport works.
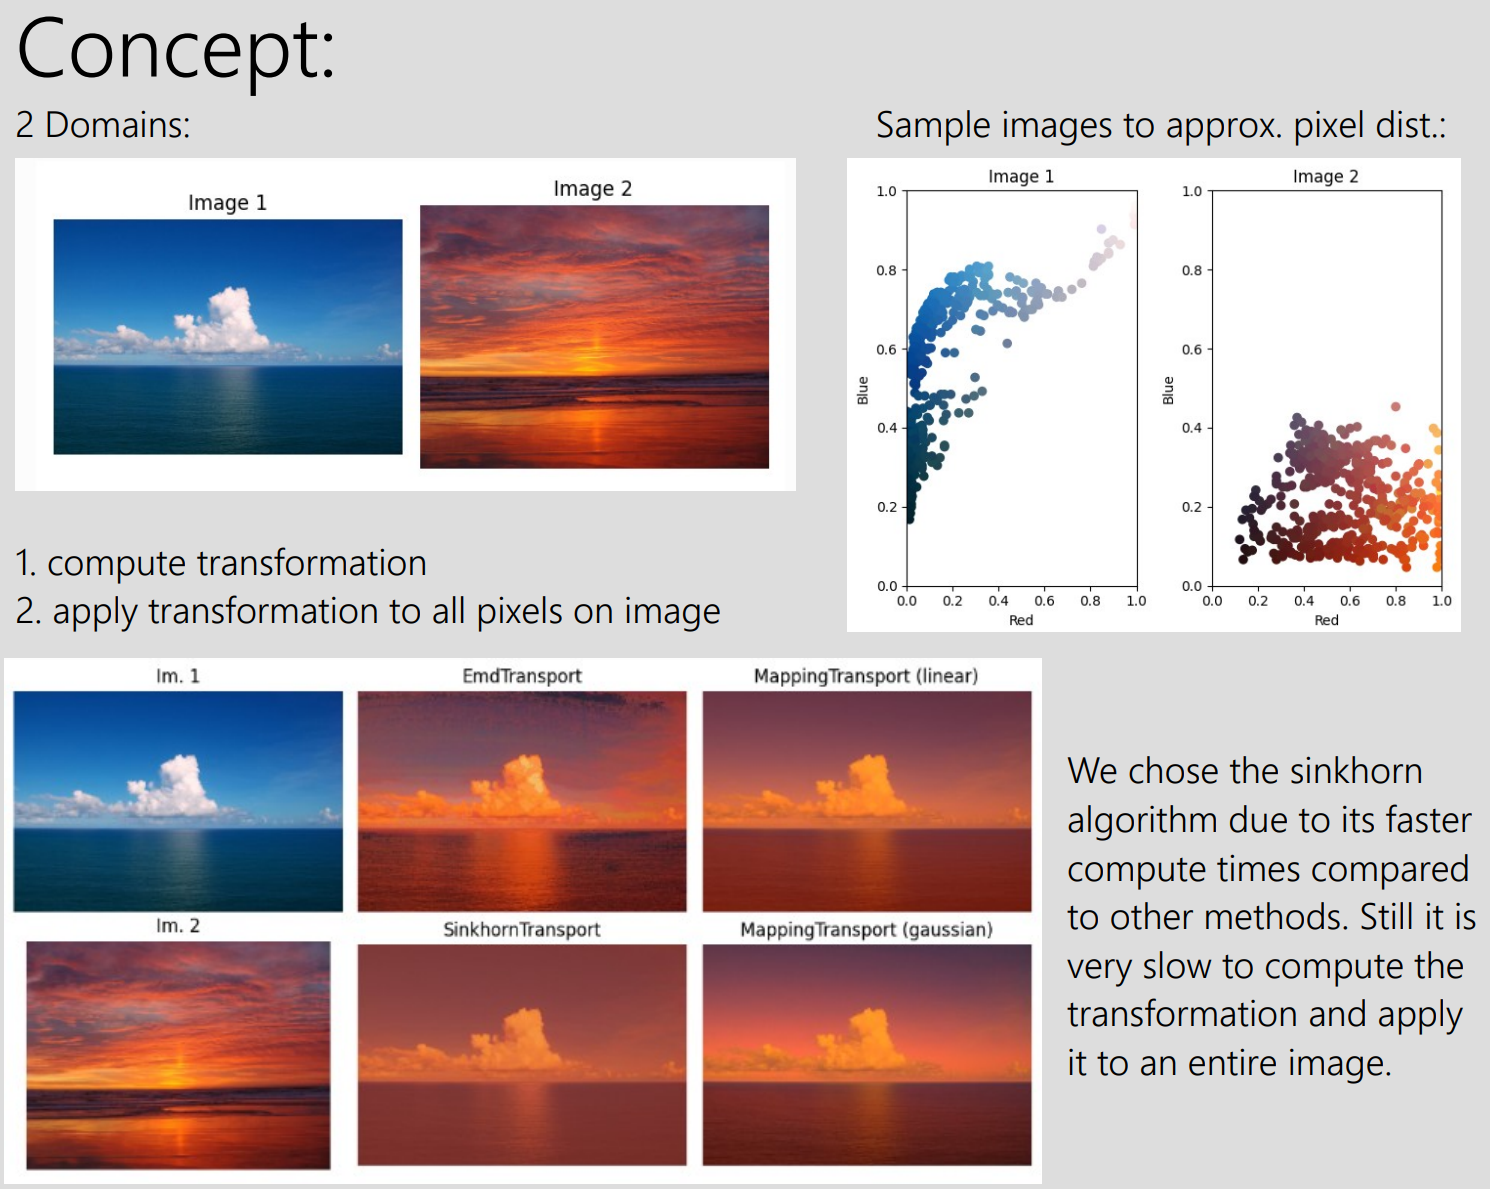 These images were taken from the Python Optimal Transport documentation website.
On our data
Unlike the example above, we had multiple images per domain. In order to fit the transformation, we sampled points from all images in our source and target domains.
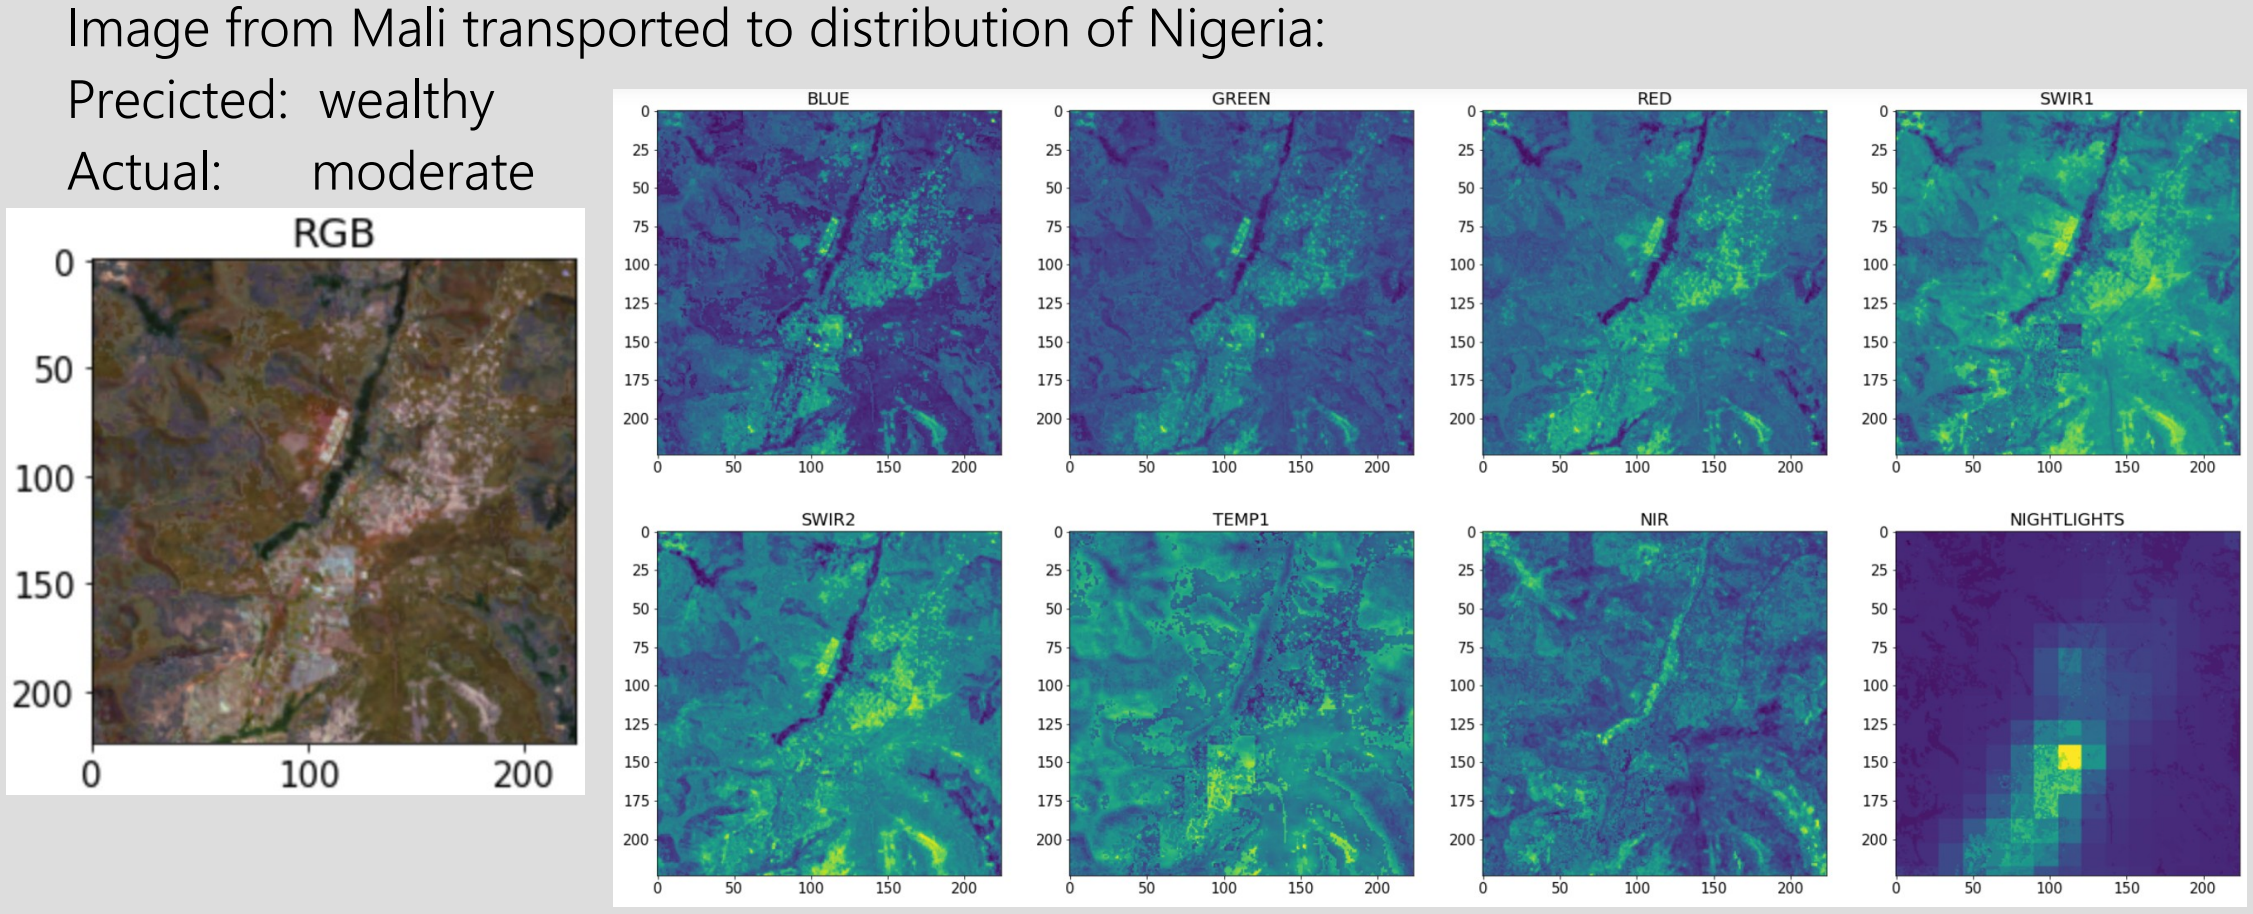
Why did the model perform worse with OT?
- Color Changes
- As seen in the RBG representations above, OT made a lot of the desert area greener to match the color distribution of Nigeria. However, the CNN likely associated a green with wealth, which led to an incorrect prediction.
- Artifacts
- Due to the low resolution nightlights channel, OT brings low resolution artifacts into other channels (as seen in SWIR1 above) and brings high resolution artifacts to the nightlights channel. This potentially creates issues for the convolutions in the CNN as there is a change in textures/ distribution of colors.
Future Work
Due to the unexpectedly high performance of the CNN on this classification task, we think it would be feasible to tackle this as a regression problem.
We believe we can fix many of the issues we ran into with OT. In order to avoid artifacts, we would exclude the nightlights channel from OT. It doesn’t really make sense to include it in the first place as it is measuring the amount of light from a wide area and as a measure, it is already domain independent. Another improvement we could make is increasing the pixel samples from each domain that OT was fitted on. This would significantly increase computation times however.